What makes a building smart?
Just like with IoT, the term smart building has a pretty broad definition. For instance, RCRWireless’s technical definition claims it refers to ‘any structure that uses automated processes to automatically control the building’s operations, including heating, ventilation, air conditioning, lighting, security and other systems.’.
On the other hand, Sustainable Technology Forum showcases an arguably more elegant and imaginative example, defining them as ‘solutions that turn buildings into living organisms: networked, intelligent, sensitive and adaptable.’
Working out a building’s “footprint”
Let’s look at the building almost as a living, breathing entity – lights and power are abound, people and equipment generate heat, the environment is regulated by air-conditioning, water goes in, waste goes out, and so forth. Through this model, we can examine the building’s “footprint” and the various aspects that make it up. For instance:
- Environmental – The physical space immediately around the building, but also the wider local space (for example, what is the pollution footprint of a factory, or even light pollution from a brightly lit office)
- Financial – What is the cost of running the building as a functional and productive entity, literally what is the cost of keeping the lights on?
- Ethical – How corporately and environmentally responsible is the building and the occupants within, in relation to similar structures?
Measurement and Verification of Smart Building Vitals
So why are we so interested in a footprint? Well, it provides us with vital data, which leads not only to awareness but predictability – something all companies crave!
In not-so-smart buildings, the footprint is not really managed or monitored. Sure, there are measurable costs, like utility bills . Reading these bills, you could record the consumption stats in a spreadsheet and come to some conclusions. However, this type of information is retrospective, and analysis only results in vague trends and ineffective blanket solutions, such as:
“Well Jim, looks like the electricity bill has gone up 20% over the last quarter, let’s make sure we keep an eye on electricity usage.”
“Sure Bob, I’ll bring it up in the next all hands. I’m sure we’ll get a handle on it.”
Nope, sorry Jim and Bob, don’t think that strategy is going to cut it.
The best way to turn a building into a smart building and measure the footprint is to “plug in” to the building. Installing sensors for electricity, water, the environment, temperature and more into the rooms and spaces. Once the sensors are operational, data is gathered with a greatly increased frequency – multiple readings are taken per hour, instead of per month, quarter, or year. Once the data is analysed and delivered in a interpretable format, Jim and Bob’s conversation above would instead sound like:
“Well Jim, looks like over the last month our electricity usage on floor 5 has shot through the roof. Let’s keep an eye on electricity usage.”
“Sure Bob, looking at the latest report, it seems like that new development team has been working late shifts to bring the new widget out in time. They’ve been leaving the lights on non-stop.”
“Thanks Jim – tell them to turn off the lights and give them a few pizzas and sodas instead!”
Through analytics, IoT sensors, and big data Jim and Bob were able to pinpoint a specific time period and location where the electricity usage spiked , and take care of it with a (not so healthy) alternative solution.
These type of implementations are called “Measurement and Verification”, or M&V systems. M&V systems not only give new insights into the living building vitals and its footprint, but also assist in making decisions to drive efficiencies and verifying bills from suppliers. Now, if the electricity supplier claims that one million kilowatt-hours of electricity was used last quarter, building managers can rest assured that the figure is actually true.
It’s worth noting that, the biggest challenge for a M&V system is the retrofit. The best time to install an M&V system is at the time the building is built. Traditional M&V systems have a deep integration into the physical structure of the building – it takes many sensors on pipes, power boards, and extensive wiring. Retrofits therefore take a lot of work, which of course comes at great cost.
Introducing Buddy – a “Fitbit for buildings”
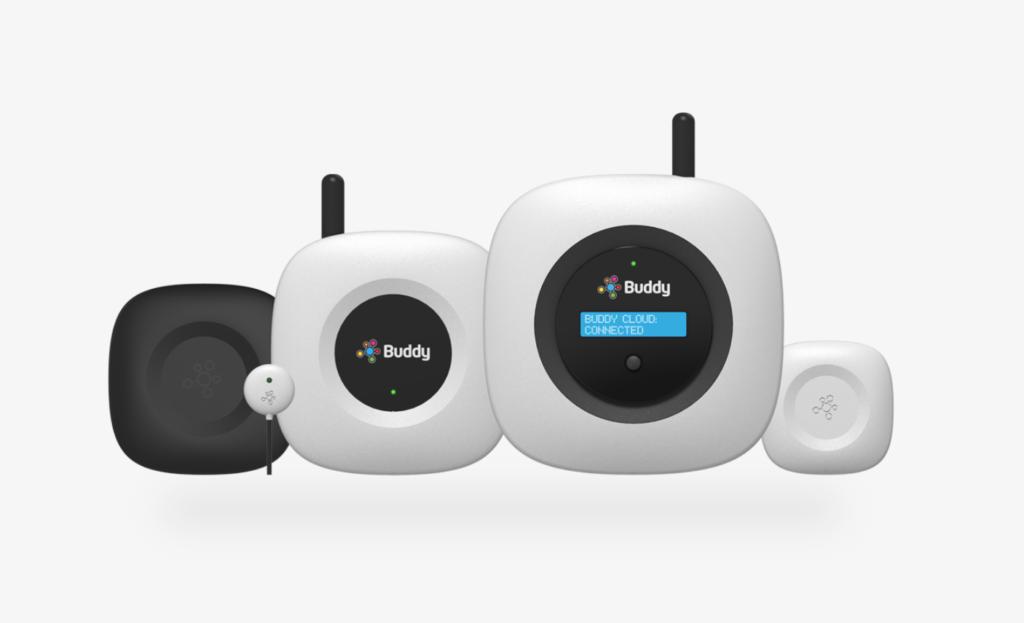
Being very aware of the complexities and install time of traditional systems, we believe M&V IoT solutions for buildings should be slick, easy to install, and scalable, with seamless IoT functionality. So, after extensive research we are now proud to have partnered up with Buddy – a Australian founded company with a global reach.

The core focus of Buddy is ease of implementation. Sensors for building vitals such as temperature, humidity, electricity, or water usage are deployed around the building. For temperature and humidity, they may be on a room by room basis. For the electricity and water, it could be by room, or perhaps by facility or function (e.g. lighting or heating).
After the sensors are deployed, they need to communicate their readings. Since there could be tens or hundreds of sensors in a building, some form of aggregation of data has to occur. This is a cleaner and more cost effective solution than having each sensor communicate directly to the cloud.
So at certain points, gateways are installed. The gateways aggregate the sensor data and pass it to the buddy cloud for processing. The gateways can connect via WiFi or ethernet, but the most common method is to connect via cellular. The buddy gateway has inbuilt cellular connectivity, which allows it to be totally independent of any underlying network. You can learn more about why cellular can win over wi-fi here.
Making it look good
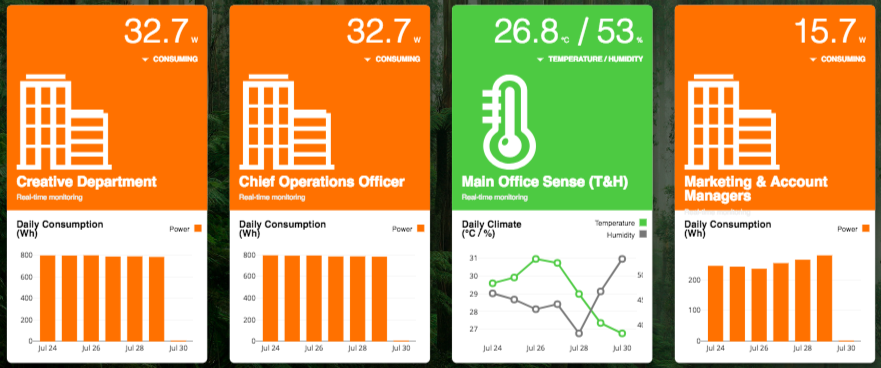
Another of of Buddy’s core philosophies is to make data look good. The guys place a large emphasis on a slick interface with visual impact. They also believe it’s important to show the pulse of the building, exactly like holding a stethoscope to the walls.
To do this, the Buddy system visualises and displays data via a Buddy display module, which outputs to a TV or display panel via a HDMI connection. Instead of showing a series of world clocks, or a loop of the news on mute, why not show the pulse and vitals of the building?
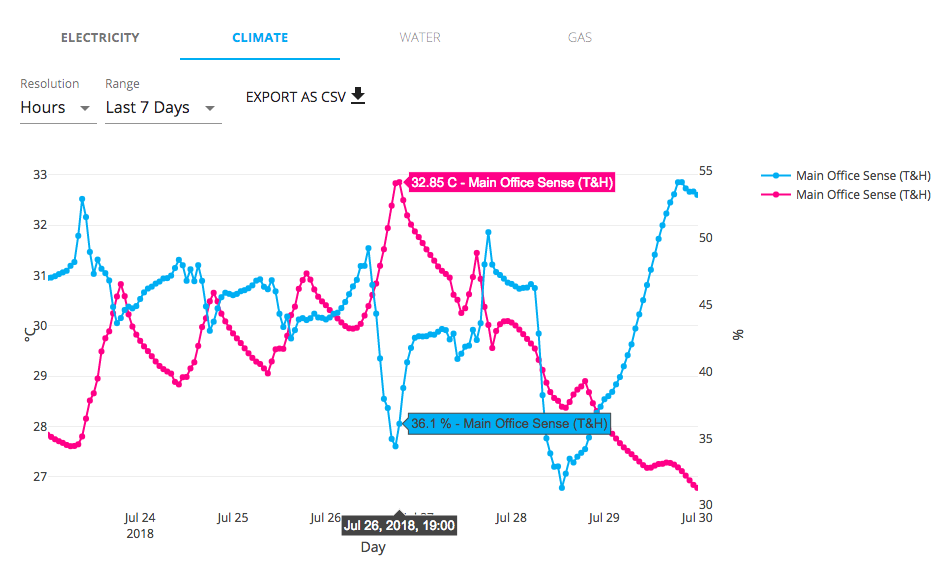
Here are some examples of Buddy dashboard in the Pangea office.

Yes, it did get that hot in the Pangea office during the heatwave (pink line).

That should do it for an intro to the Buddy platform. In the next blog post we’ll be getting in depth with some more deployments and features. In the meantime, you can learn more about Buddy here.
If you want to know about Buddy or have any other questions, feel free to get in touch with us at contact@pangea-group.net.
Learn more about our smart building energy management solution
Related Articles:Pangea and Buddy set to change the energy game with smart building solution Smart Buildings: beyond four walls and a roof
|
Explore: |


Comments are closed.